
On This Page
Need more help?
 Contact Us
Currently, there is a varied approach to the creation, storage, and deployment of video-based content across Academic Groups and central services.
Video management systems
Griffith has multiple enterprise systems for managing video objects – Echo360, Microsoft, Class Collaborate and, more recently, Canvas Studio.
In principle, the storage of the file should be kept within the platform in which it has been created unless there are requirements to move to Canvas Studio.
SYSTEM | DESCRIPTION | RECOMMENDED STORAGE |
|---|---|---|
Canvas Studio | Videos required for your course site including:
| Upload to Canvas Studio (Canvas Guides) Course Library for integration into the Canvas LMS. Remember to add captions to your video (Canvas Guides) so it is accessible. |
Echo360 | Many Griffith teaching spaces are enabled with Echo360 equipment which automatically records and publishes timetabled activities. Echo360 Universal Capture allows users to generate recordings from your computer to share. | Keep in Echo360 unless you want to edit the recording. In which case, a new recording can be stored on Canvas Studio (based on use case). |
| Class Collaborate | Online teaching can occur in Class Collaborate. | Class Collaborate recordings are accessible via the burger menu within Collaborate in each course site. If you want to edit or re-use the recordings for additional teaching periods, you may want to move this recording to Canvas Studio (based on your use case). |
Microsoft (Teams) | Online teaching can occur in Microsoft Teams. | Microsoft Teams meetings that are recordings are automatically stored on SharePoint, and will auto-expire 180 days after creation. If you want to edit or re-use the recordings for additional teaching periods, you may want to move this recording to Canvas Studio (based on your use case). |
Microsoft (Stream) | For video assets that require broader or external permissions. (Updated 2025) | Store in Microsoft Stream (Productivity Hub). |
A streamlined automated editing process is now available via ClipIt. This service enables users to load a file or link a Youtube link and request trimming, editing, bookmarking and entering title page.
Embedding videos from YouTube, Vimeo or other sources into your Canvas Course Site should reference the author directly under the embedded video.
How to upload videos to Canvas Studio
- Access Studio from the left-hand navigation menu in Canvas.
- Upload media files by either:
- Dragging and dropping them into My Library, or
- Using the Add Media link
For more details, see How do I upload media files in my Canvas Studio account? (Canvas Guides).
Embedding videos in Canvas
Once your videos are in Canvas Studio, you can directly embed them into any Canvas page. For specific instructions, visit How do I embed Canvas Studio media in a Canvas course? (Canvas Guides).
Analysing video interaction
You can leverage video-based learning analytics to assess how your cohort is interacting with course video content.
This data provides valuable insights into how actively students are engaging with course videos, what material is most compelling and what might need improving in future iterations of the course.
Canvas Studio Insights
Select your video and choose the Insights tab to view interaction insights in Canvas Studio.
Canvas Studio Insights allows you to access:
- usage metrics
- interactive graphs
- a searchable viewer listing displaying ‘completion’ rates and more.
Ways to use Studio Insights metrics:
Engagement: Use Insights to ensure cohort completion.
- How do you know if your content is being actively consumed? This metric lets you know!
- If the data shows uptake is low, prompt students to interact with the course resources. You can also download a CSV file containing completion rates for each video to also assist with your monitoring activities
Fit for purpose: Use Insights to see when a video has been replayed too often.
- If you notice a video has been replayed frequently by different viewers, it could signal an issue with the resource. For instance, the video may be too long, or not appropriately segmented/bookmarked.
Cognitive load: Use Insights to find most ‘skipped’ parts.
- Examine the ‘view number of plays’ graph to identify sections of the video that have been skipped or viewed less frequently. This graph visually highlights peaks (most played/replayed) and valleys (skipped) throughout your video timeline allowing you to pinpoint content that may require improvement in the future.
Course design enhancement: Use Insights for iterative course design.
- Upon reviewing your data, you may discover specific days or times when video consumption was highest or identify videos your cohort didn’t complete or engage with at all. This information might prompt you to review the resource and make a plan to improve it for future courses.
For more information, see Canvas Studio Insights (Canvas Guides).
EchoVideo Analytics
Echo360 provides an array of analytics including student engagement, video views, what percentage of a video is viewed, poll responses and more. These metrics and reports help you determine what level of engagement and participation is occurring in your course and if your video content is fit for purpose. Armed with data, you can make informed decisions about how to communicate with students to increase interaction with course content and identify resources to improve in the future.
Working with the data
The analytics have a default set of engagement criteria to generate data, but you can customise them to reflect metrics that are of most interest to you. It’s recommended you first review these settings and criteria prior to accessing the analytics data.
The engagement score is calculated using a combination of metrics in Echo360 Analytics. Keep in mind, a low engagement score for a particular student may be due to a number of factors. For example, they have misplaced or broken their device; they prefer to attend class and take notes rather than work online; or they are engaging in alternate ways.
Accessing EchoVideo analytics:
Go to EchoVideo and select either;
- Classes tab - this provides the total number of times the video in the class was viewed by students in the section.
- Students tab - this provides the number of times each listed student viewed videos in the Echo section, both for all classes (via dashboard) or for a particular drilled-down class when viewing student details link or the exported data.
Please note, these analytics in Echo360 are independent of LMS or Google analytics.
For more information on EchoVideo analytics, see:
Microsoft Stream on SharePoint Video Analytics
If you are using Microsoft Teams for class engagement, you may have recordings you’d like to re-deploy into your course site. These are normally found in your OneDrive account or the Recordings folder of the relevant Teams channel, depending how the meeting was set up.
Are your recordings ‘fit for purpose’?
There are some basic analytics available to help you decide.
Stream on SharePoint provides the total number of views and viewer retention analytics (how users engaged with your video across the timeline). Hover over the analytics graph to identify which parts of the video have been viewed the most. This may assist in identifying areas of confusion or suggest that the video is better suited to be divided into chunks or bookmarked. This ensures the delivery of important information in segments, enhancing ease of use when re-deployed to Canvas Studio (recommended for deployment in LMS).
You can also access geographic analytics, and average watch times, providing additional insights into the usage profile of your cohort.
Microsoft Stream Update
Microsoft is phasing out Stream (Classic) and replacing it with Stream (on SharePoint). Existing links and embed codes will redirect to the migrated videos in Stream (on SharePoint) until 15 February 2025. After this date, existing embed codes will no longer function and must be replaced.
To check if a video is from Stream Classic, look for a warning message displayed above the embed:
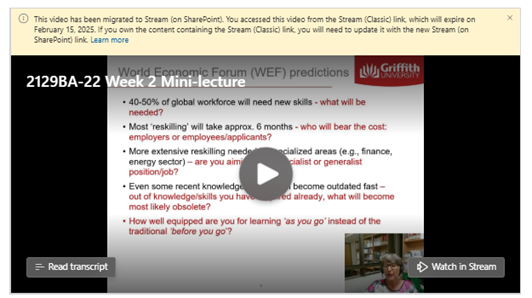
All videos from Stream (Classic) have been migrated to Stream (on SharePoint). The new videos can be found in the owner’s Griffith University OneDrive in a folder called ‘Stream Migrated Videos’.
From here, you can replace old links with the migrated videos. However, it is strongly recommended that you upload these videos to Canvas Studio.